AI for Australian utilities works best in five areas: smart meter analytics (anomalies, theft and network faults), customer service for billing and outage queries, inspection automation for poles, lines and vegetation, demand forecasting under rooftop solar and electrification, and field service scheduling. Most of the effort sits in data quality and integration with billing, GIS and work order systems.
Key takeaways
- The AEMC's November 2024 rule change targets universal smart meter deployment across the NEM by 2030, creating a large new data stream to analyse.
- Smart meter AI is mostly a data quality problem before it is a modelling problem.
- Customer service automation should start with billing and FAQ queries, with immediate escalation for hardship and vulnerable customers.
- Drone, LiDAR and image analytics speed up asset and vegetation inspection, with engineers reviewing findings.
- Field service optimisation depends on accurate GIS asset locations and consistent work order data.
Why utilities are moving from AI pilots to production
Australian energy retailers, distributors and water utilities face rising data volumes, electrification, rooftop solar, ageing assets and customer expectations shaped by digital services. Many have AI pilots; fewer have AI running reliably in core operations. The gap is usually integration with decades-old billing, asset and meter data systems, plus safety and regulatory caution.
Smart meter analytics
The regulatory context
In November 2024 the Australian Energy Market Commission made a final rule to accelerate smart meter deployment, targeting universal coverage across the NEM by 2030. The AEMC's analysis estimated significant net benefits from the accelerated rollout. Victoria already has near-universal smart meter coverage from its earlier mandated program.
A meter recording five-minute intervals produces 288 readings a day, or 105,120 a year. Across millions of meters, manual analysis is impossible.
- CaptureInterval data from smart meters
- ValidateFill gaps, remove duplicates, fix multipliers
- AnalyseModels detect anomalies and patterns
- AlertFlag theft, faults and network issues for review
- ActInvestigations, revenue recovery and network planning
Where AI adds value
Anomaly and theft detection. Models such as isolation forests and autoencoders learn normal consumption by customer segment and flag deviations that suggest tampering, bypass or faulty equipment, excluding explainable causes like weather or holidays. Investigators then decide what to pursue.
Network health. Victorian distributors have used smart meter voltage and impedance data to identify neutral integrity faults early, instead of waiting for periodic inspections. The same data supports low-voltage network visibility as rooftop solar and batteries spread.
Implementation reality
Meter data systems routinely contain missing intervals, duplicate readings from migrations, wrong multipliers and time zone inconsistencies between providers. Build a data quality layer first and budget a large share of effort for it.
Customer service automation
A large share of utility contact centre volume is repetitive: billing questions, outage reports, payment arrangements, moving house and plan questions. Major Australian retailers including AGL have publicly discussed digital assistants that handle routine conversations.
What works:
- Start with billing and FAQ queries: clear answers, high volume, low risk.
- Integrate with billing: "Your balance is $234.56 due on 15 January" beats "please log in".
- Escalate deliberately: hardship, complaints, life support customers and anyone showing vulnerability go straight to a person, consistent with retailer obligations.
- Measure containment and satisfaction together, so you do not optimise for deflection at the expense of customers.
See our guide to customer service automation that works.
Inspection automation for poles, lines and vegetation
Inspection is one of the most active areas of utility AI, and a frequent topic among utility operations startups.
- Drone and helicopter imagery classified for damaged insulators, cross-arm decay, corrosion and missing components.
- LiDAR for vegetation clearance against bushfire mitigation and clearance obligations.
- Satellite imagery for vegetation growth screening across long rural networks.
- Thermal imaging to spot hot joints and failing connections.
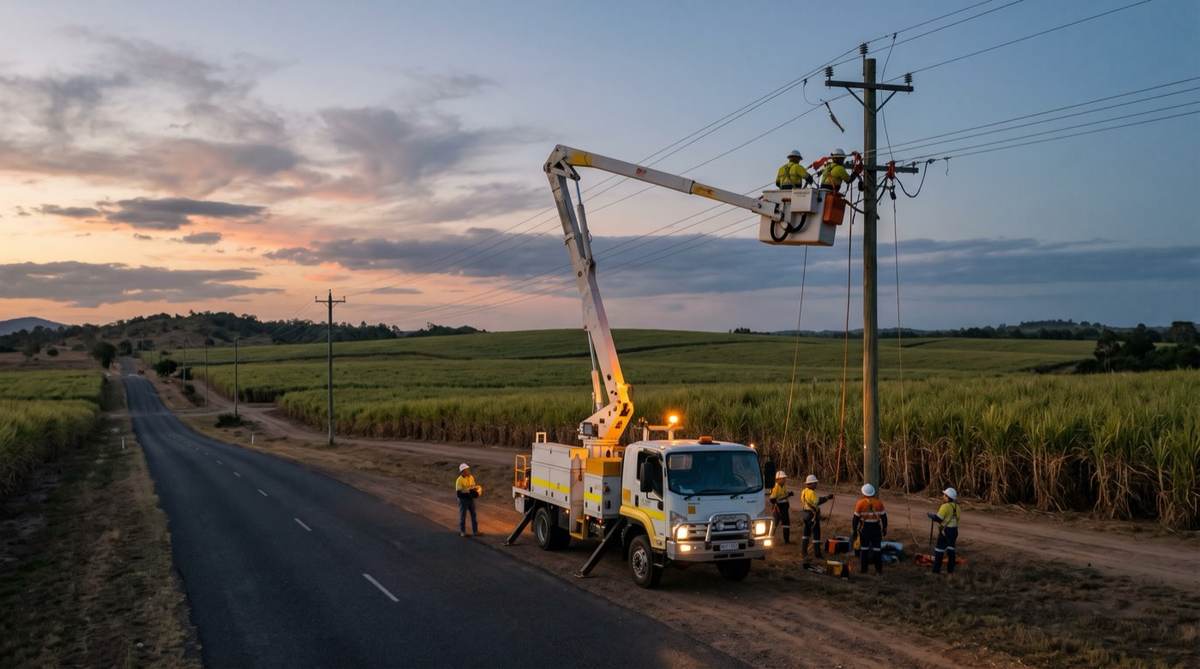
AI reduces the hours engineers spend reviewing imagery by surfacing likely defects first. Engineers confirm findings and own the decisions, and confirmed defects should flow into the asset management and work order system automatically. See our asset health guides for transport fleets and local councils for the same pattern.
| Manual review | AI-assisted | Impact | |
|---|---|---|---|
| Imagery review | Every image checked by a person | Likely defects ranked for review first | Faster |
| Coverage | Cycle-based sampling | More frequent, wider coverage | More current |
| Vegetation risk | Periodic patrols | LiDAR and satellite screening between patrols | Earlier |
| Work orders | Re-keyed from reports | Created from confirmed findings | No retyping |
Demand forecasting
AEMO's Integrated System Plan expects electricity consumption in the NEM to nearly double by 2050 as transport, heating and industry electrify. Volatility is rising too: rooftop solar, batteries, electric vehicles and large new loads such as data centres, which AEMO has begun forecasting as a separate component.
AI-based forecasting can combine smart meter data, weather forecasts, solar and wind forecasts, EV charging, demand response participation, economic indicators and special events. Hybrid models that combine statistical methods with machine learning tend to hold accuracy better than pure ML, which can overfit to patterns that will not repeat.
Think in three horizons:
- Operational (minutes to hours): balancing, demand response and emergency response, using streaming data.
- Short-term (day to week ahead): trading, scheduling and maintenance planning, where weather is critical.
- Strategic (months to years): investment, tariffs and regulatory submissions, where scenarios matter more than point accuracy.
Use different approaches for different horizons.
Field service optimisation
Every field organisation shares the same complaint: technicians spend too long driving. For example, a utility with 200 field staff who spend a large share of their day travelling recovers substantial capacity from even a modest reduction in travel, as more jobs completed per day, not necessarily fewer people.
Platforms such as SAP Field Service Management, Salesforce Field Service and IFS schedule against skills, parts, location and service levels. Benefits include higher first-time fix rates, more work orders per day, fewer return visits and safety constraints such as fatigue and hazard proximity built into scheduling.
The integration challenge: you need accurate asset locations, real-time technician status, consistent job categories, van stock linked to inventory and customer appointment preferences. If the GIS has assets in the wrong place, the optimiser works from fiction.
What is not working
- Expectations outrun delivery. Leaders expect fast results, then hit integration and data problems.
- Legacy systems. Billing, asset and meter platforms were not designed for real-time analytics.
- Change management. Unionised workforces and strong safety cultures need genuine consultation.
- Trust. For safety-critical infrastructure, human oversight is essential and should stay that way.
A practical path for utilities
What is your most pressing problem?
- Contact centre volume and costCustomer service AI for billing and FAQs
- Revenue leakage or network faultsSmart meter anomaly detection
- Inspection backlog or bushfire riskAI-assisted imagery and LiDAR review
- Technician productivityField scheduling after GIS and work order clean-up
- Forecast error in trading or planningHybrid demand forecasting models
- Months 3-6Customer service AIBilling and FAQ assistant with clear escalation paths
- Months 6-12Meter data and inspection analyticsAnomaly detection, network health and imagery triage
- Months 12-18Field service optimisationScheduling and routing on clean GIS and work order data
- Months 18-24Demand forecastingHybrid models for trading and network planning
- Routine contacts handled without an agentContact centre capacity
- Theft and faulty meters found soonerRevenue recovered
- Imagery reviewed fasterInspection backlog reduced
- Less technician travelMore jobs per day
- Better short-term forecastsLower trading and balancing cost
Set targets for each phase from your own baseline, such as containment rate, revenue recovered, imagery review hours and jobs per technician per day.
How Solve8 can help
Our consultants bring operations data experience from careers spent around industrial and energy systems, including work in Schneider Electric and Senex Energy environments. We connect meter, billing, GIS and work order systems, build analytics and triage models, and keep engineers and customer teams approving outputs. AI runs on your infrastructure in Australia. See our mining, energy and manufacturing work and system integration, or talk to our team.