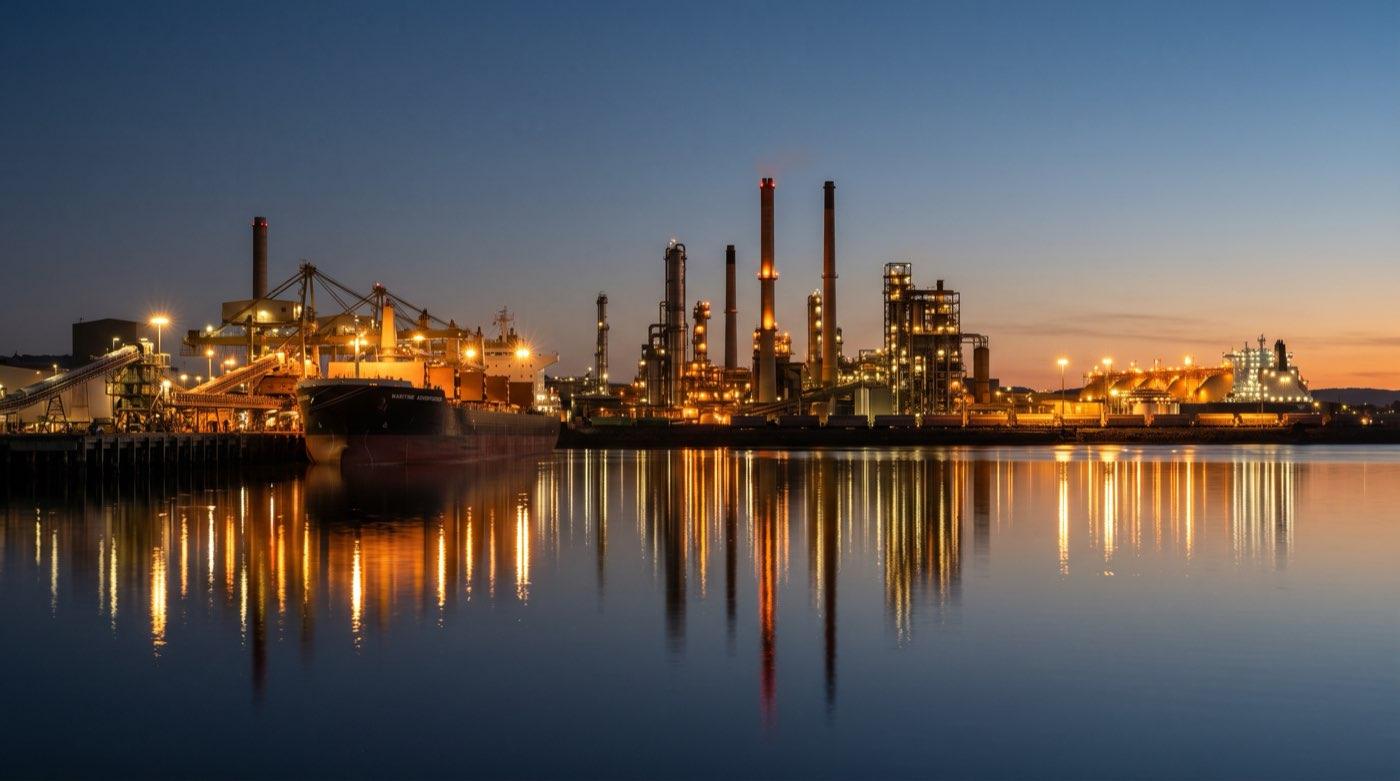
Gladstone and Central Queensland
AI consulting for Gladstone process and emissions data
AI consulting for Gladstone refineries, smelters, LNG and port operators reporting against Safeguard Mechanism baselines that decline each year.
What we work on in Gladstone
Alumina and aluminium
Energy intensity per tonne, assembled from several systems and calculated one agreed way.
LNG processing
Process history, flaring and venting records reconciled across plant, commercial and regulatory periods.
Safeguard Mechanism and NGER
Declining baselines turn an annual report into a trend you have to defend.
Historian and process data
Asset models that let a query ask about a unit instead of a tag.
Port and logistics
Shipping and stockpile figures lined up with what the plant says it produced.
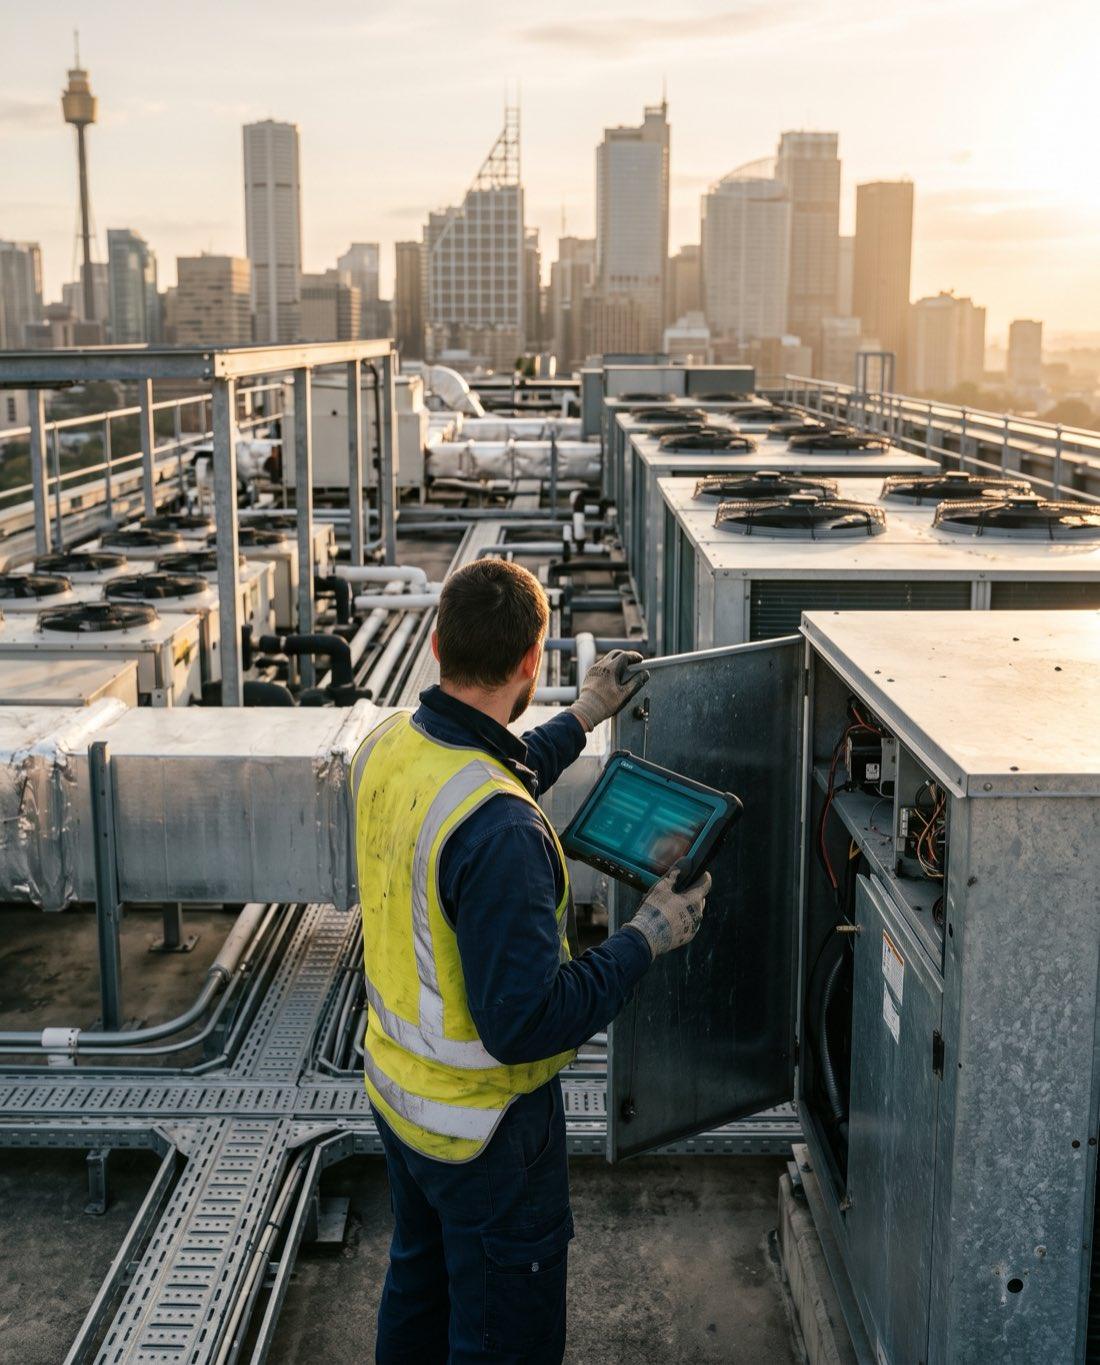
The hard part is lineage
Most facilities can produce the number. Fewer can produce the working. We put alignment decisions and calculations somewhere your organisation owns, so producing a figure and explaining it become the same action.
- Emissions data lineage
- Power BI over historian data
- Carbonly.ai, our own ESG automation product
- Reporting automation like our Tier 1 infrastructure work
How we work with Gladstone operations
Trace one figure
A focused first phase traces one reported figure back to its measurements.
On site when it helps
We walk the plant where it adds something, and say so when it does not.
Remote between visits
Historian, reporting and integration work rarely needs anyone on site.
Hand over the method
Calculations and decisions documented so they survive staff changes.
Questions
What does AI consulting look like for a Gladstone LNG or alumina operation?
It usually starts by tracing one reported emissions or production figure back to its measurements, then automating that calculation so it comes out the same way every period. Our consultants work with Gladstone refineries, smelters, LNG plants and port operators, visiting site where it helps.
How does the Safeguard Mechanism change what we need from our data?
It turns reporting into a decline obligation, so you must show how each figure was derived, consistently, year after year. That is a data lineage problem, and the working is what gets examined.
Should we replace our historian before starting an emissions data project?
Usually not. The existing historian almost always holds what you need, and the gap is an asset model and documented calculations on top of it. We support the PI System and other historians and resell none of them, so we have no reason to push a migration.
Can you help with NGER reporting for a Gladstone facility?
Yes. Across our consultants' careers that includes engagements at BHP, Rio Tinto, Senex Energy and Schneider Electric, and we built Carbonly.ai, our own emissions and compliance product, so we know how facility data turns into an NGER figure.
Can you reconcile Gladstone port and shipping figures with plant production?
Yes. We line up shipping, stockpile and wharf records with what the plant reports it produced, agree when each tonne is counted and document every adjustment. The same method suits agricultural and other bulk exporters moving product through the port.
Related
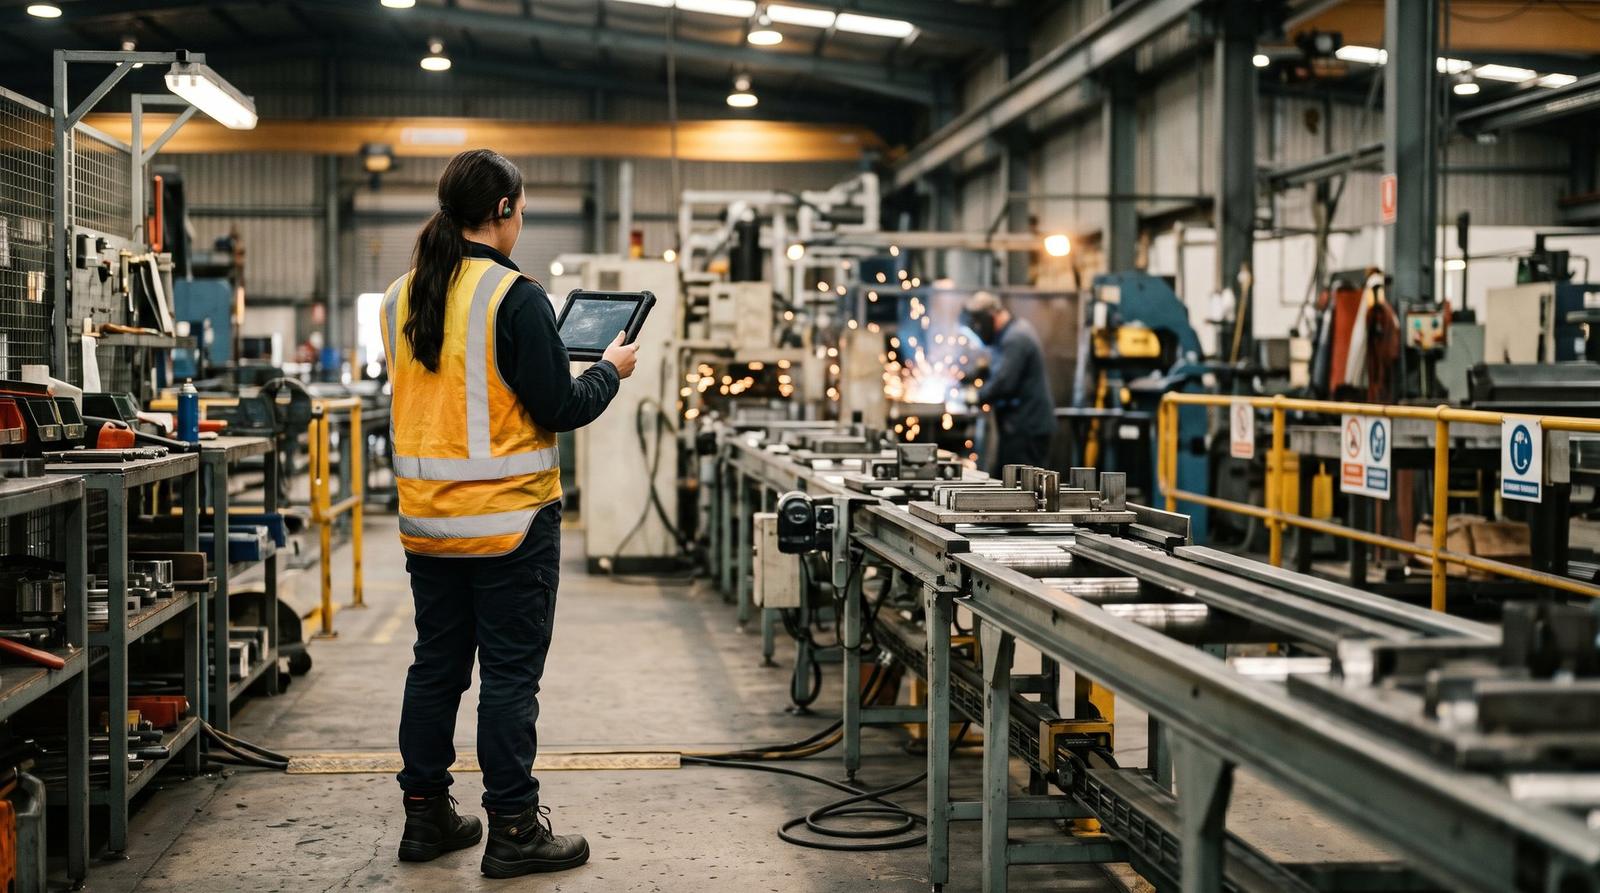 Mining, energy and manufacturingOT data, historians and reporting.
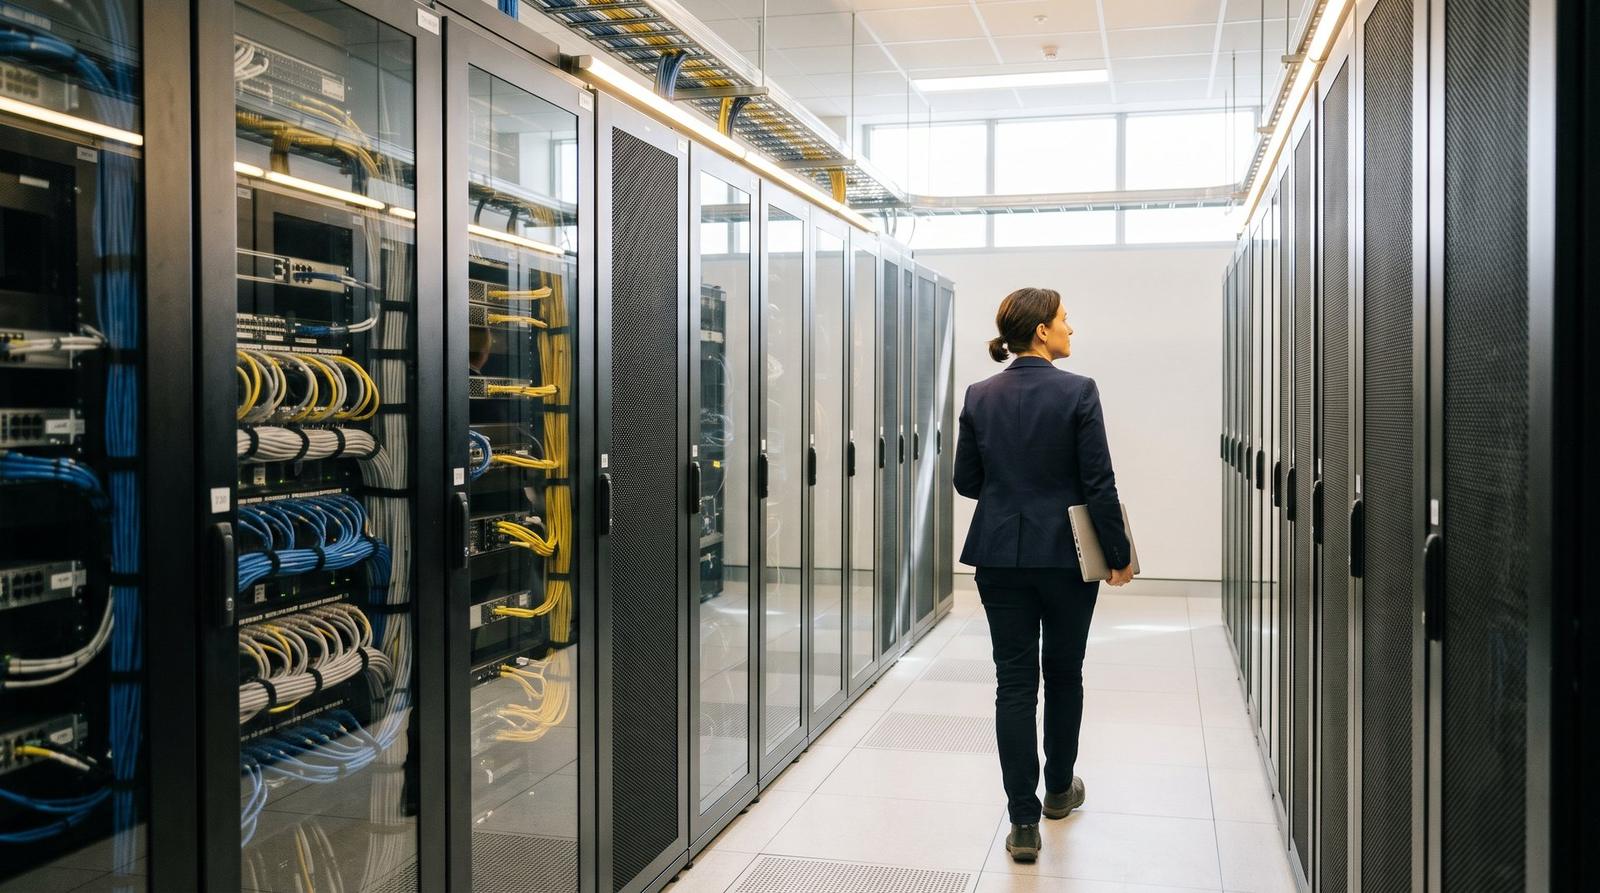 Data, BI and analyticsOne version of your numbers.
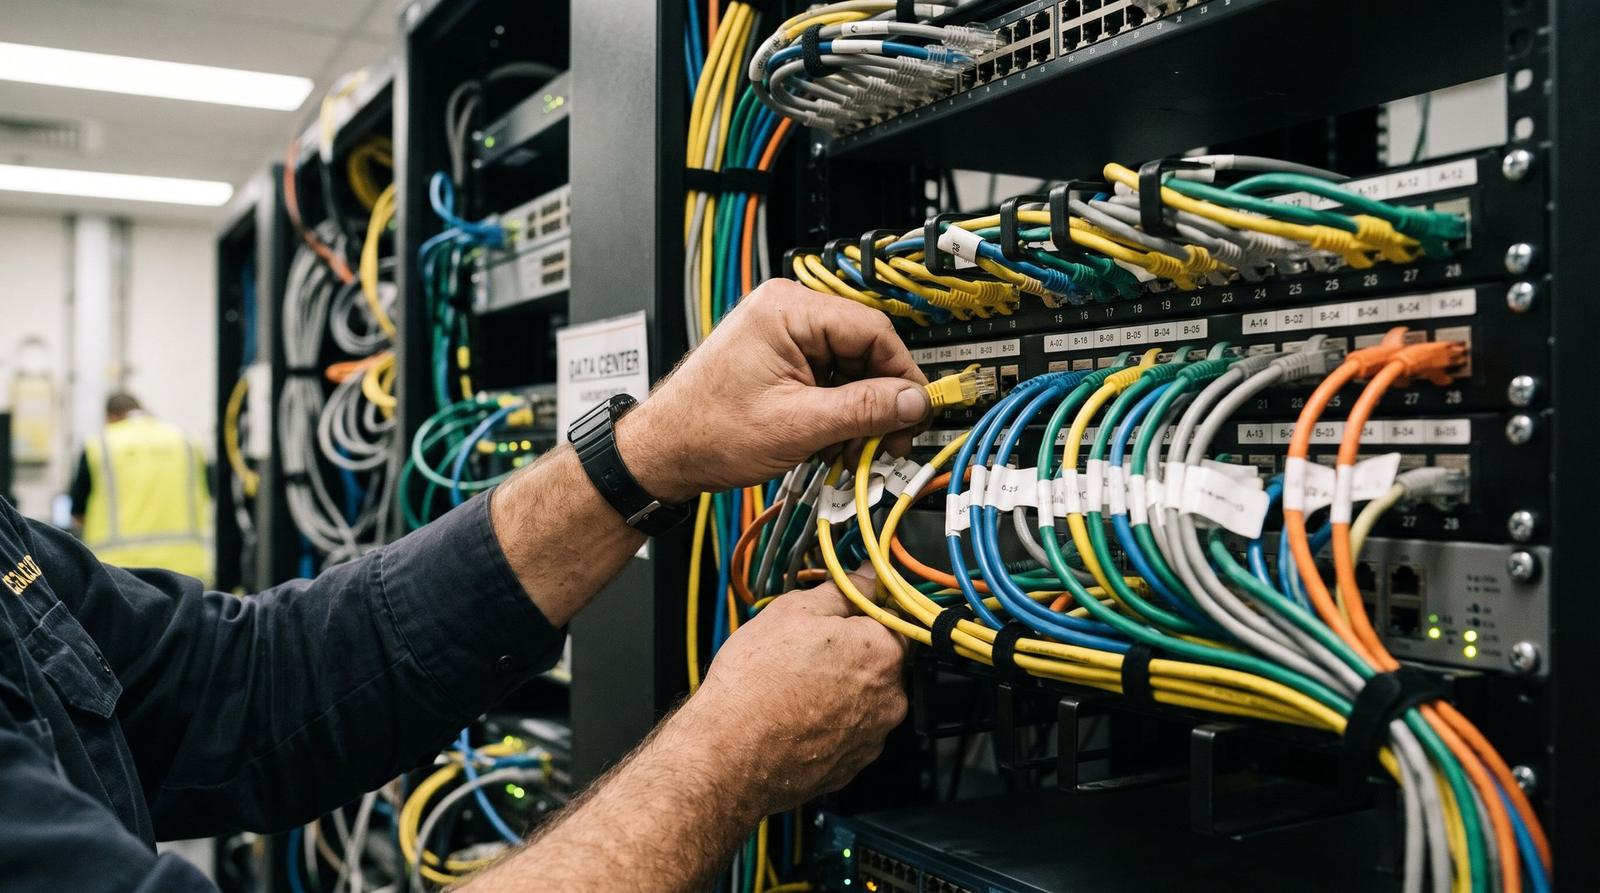 System integrationConnections between the systems you run.
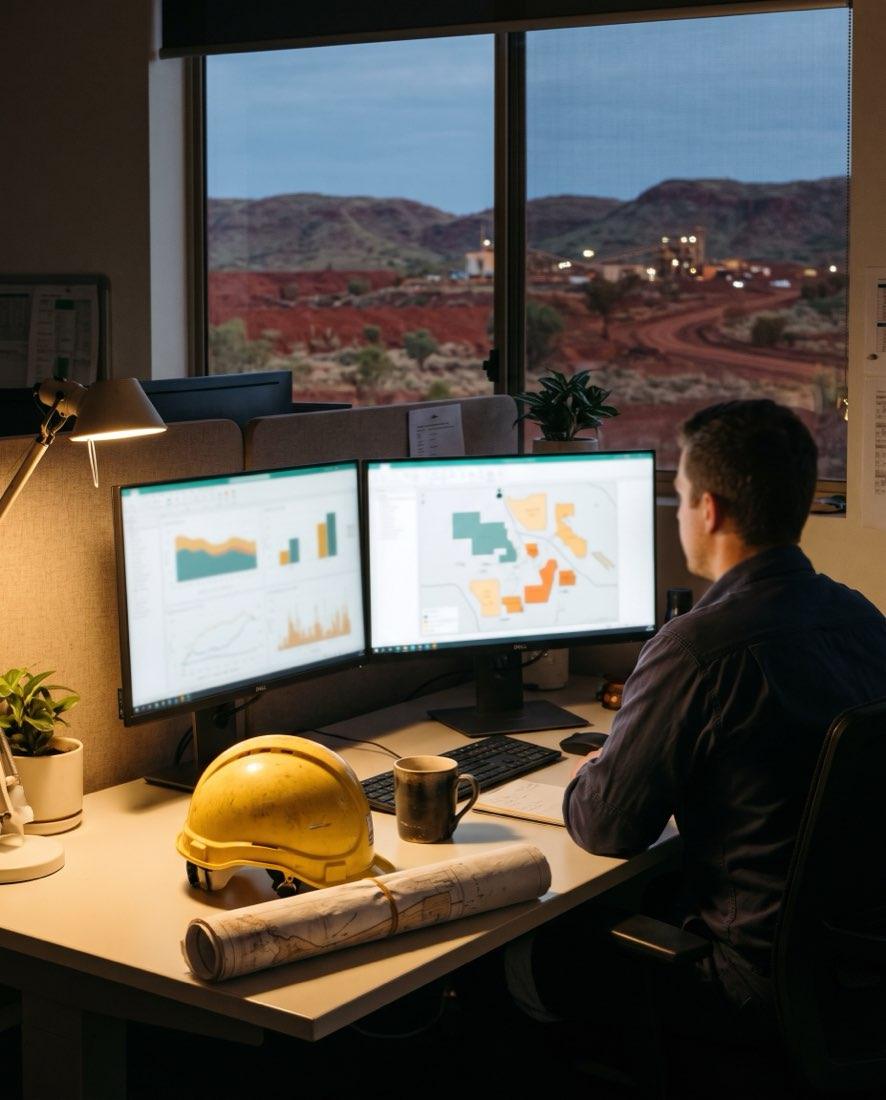 Carbonly.aiOur own ESG and emissions reporting product.
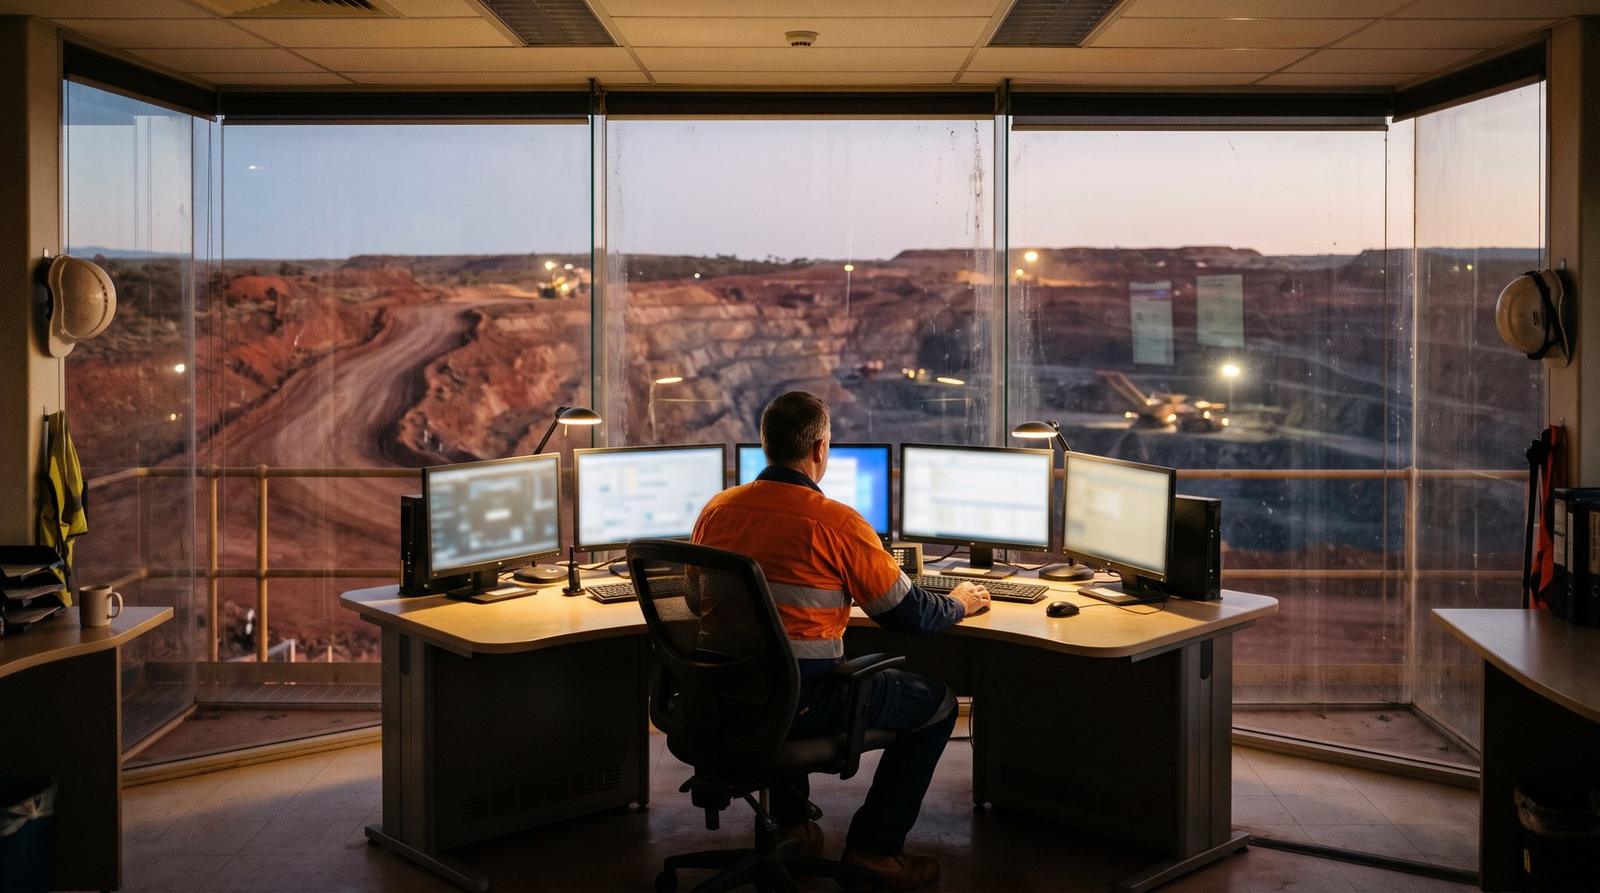 Power BI vs PI Vision for plant reportingDifferent audiences, different time scales. What sits between your historian and your reports decides whether anyone trusts the numbers.
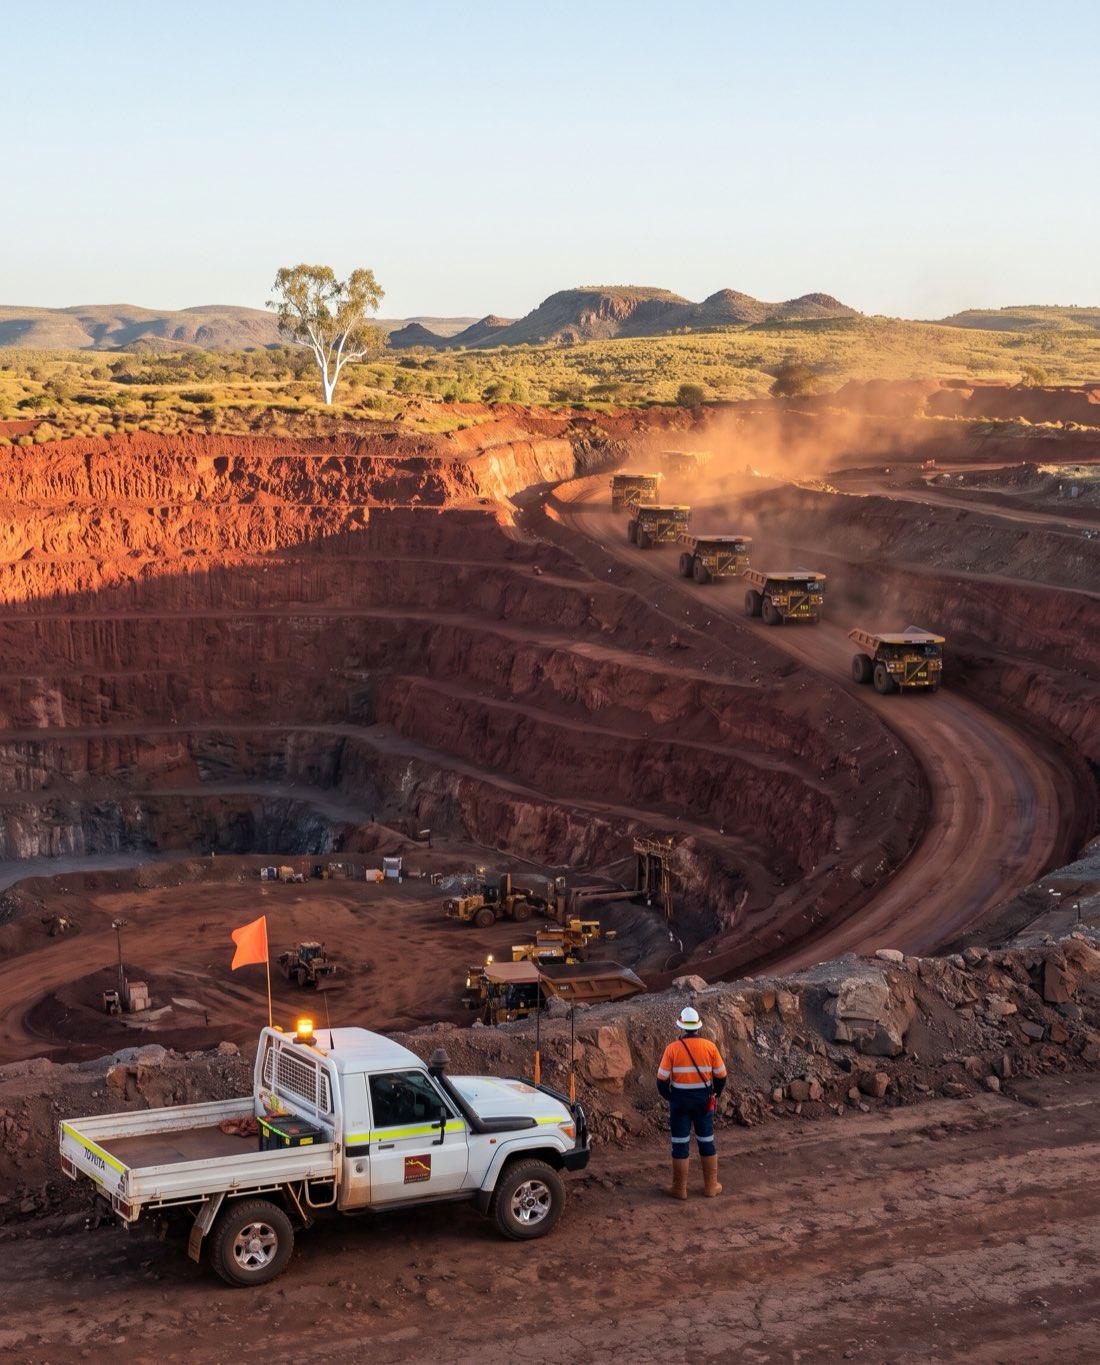
Pick the figure you least want audited
We will trace it back to its measurements and show you where the lineage breaks.
Workshops run on site in Gladstone. Our team works remotely between them.