Operational technology comparison
Power BI vs PI Vision for plant reporting
Different audiences, different time scales. What sits between your historian and your reports decides whether anyone trusts the numbers.
The short answer
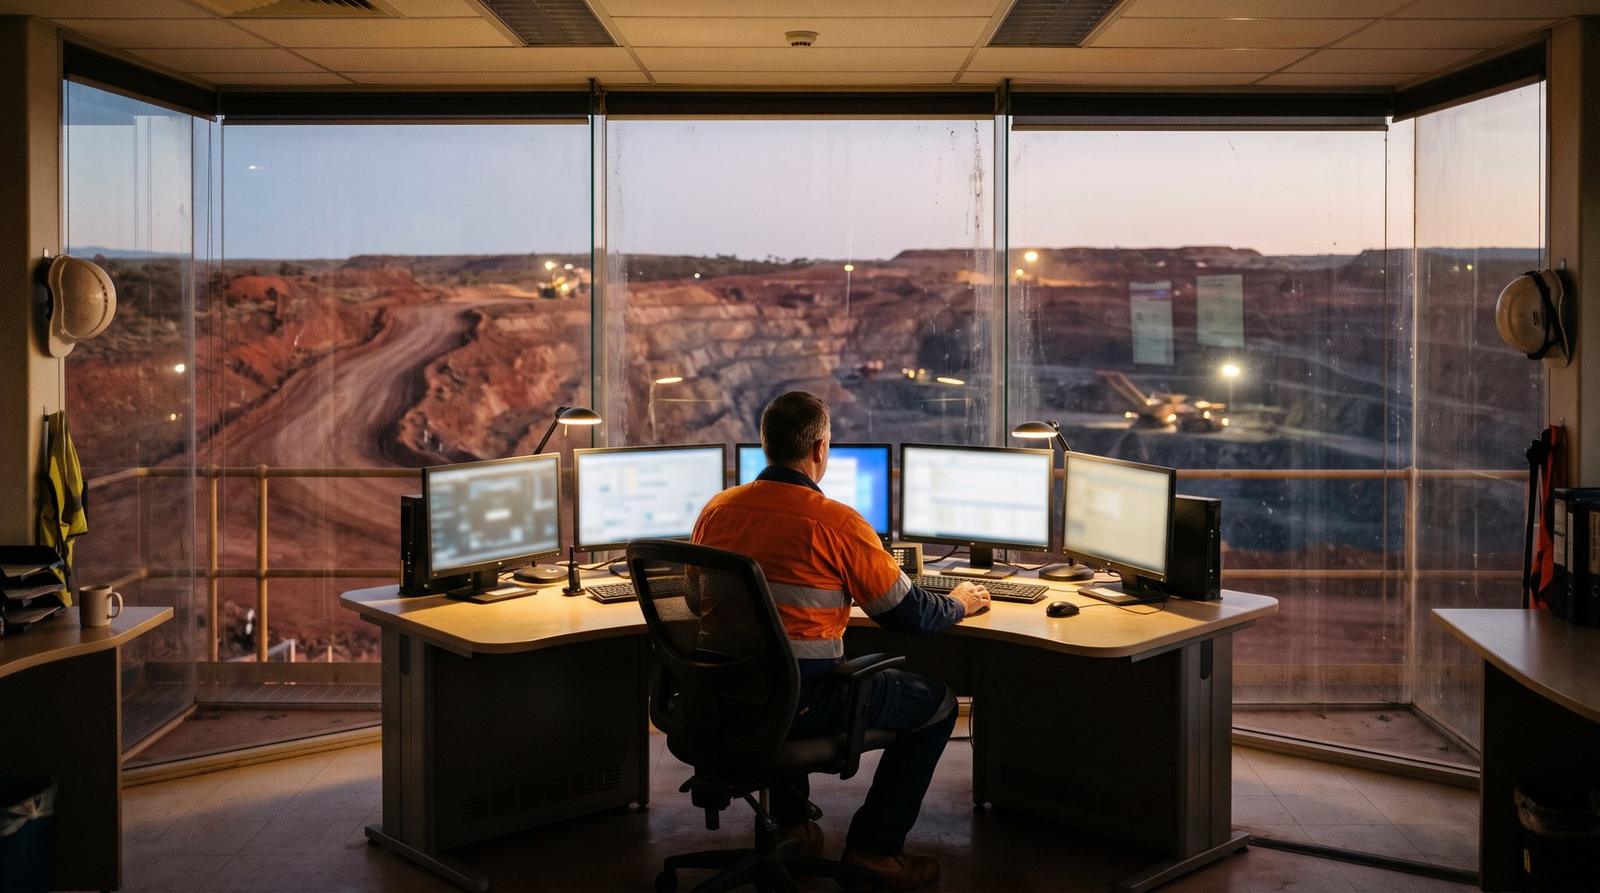
PI Vision belongs in the control room, showing live equipment state to people who may need to act within minutes. Power BI sits above it, joining production to cost and ERP for people planning next quarter.
Pointing Power BI at raw process history is the failure that repeats: fast in testing, then the refresh stops finishing once a year of data builds up. Our consultants built reporting over plant data on BHP, Rio Tinto, Senex Energy and Schneider Electric engagements earlier in their careers.
Side by side
| PI Vision | Power BI | |
|---|---|---|
| Audience | Operators and supervisors | Management and group functions |
| Horizon | Now and the last few hours | Shift, month, quarter, year |
| Latency | Live, at process resolution | Scheduled refresh, or DirectQuery with a load cost |
| Data sources | The PI System | Many sources joined in one model |
| Join production to cost | No | Yes, the main reason sites want it |
| High-resolution time series | Native | Needs aggregating first |
| Asset context | From Asset Framework templates | Whatever the model carries |
| Distribution | Users with PI access | Organisation-wide, with row-level security |
| Regulatory reporting | Source of evidence | Reporting surface, when calculations are modelled and traceable |
What sits between them
Historian
Raw signals at process resolution.
Asset context
Tags become equipment.
Aggregate
To shift, hour or batch.
Model
Agreed measures, one definition.
Power BI
Joined to cost and ERP.
Which layer are you missing?
| Gap | Fix | |
|---|---|---|
| Management reporting rekeyed from plant screens | Reporting layer | Build it on a modelled layer |
| Two reports disagree about the same month | Definitions | Model the measures once, upstream |
| The Power BI refresh no longer finishes | Aggregation | Reduce the grain before it lands |
| Operators cannot see equipment state | Monitoring | PI Vision displays |
| Production and cost cannot appear together | Joined model | Power BI over a layer that carries both |
Questions
How does Power BI get data from the PI System?
Usually through PI Integrator for Business Analytics, the PI Web API or a data warehouse that PI feeds. Most sites add a shaping layer in the middle that aggregates to shift, hour or batch, which keeps load off the historian and refresh times short.
Should management reporting come from PI Vision or Power BI?
Power BI, in most cases, because management questions join production with cost, maintenance and ERP data that PI Vision cannot see. PI Vision remains the right tool for operators and supervisors watching live equipment state.
Why does our Power BI refresh fail on plant data?
Usually because raw process history lands in the model at full resolution. A year of one-minute data across thousands of tags outgrows scheduled refresh. Aggregate to the grain management reads, such as hour, shift or batch, before the data reaches Power BI.
What makes plant reporting in Power BI trustworthy?
Defining each calculation once, upstream of every report, and keeping a trail from the reported figure back to the historian tags it came from. When two reports disagree, the cause is almost always a measure defined twice.
Can Microsoft Fabric sit between PI and Power BI?
Yes. Fabric or another lakehouse can be the layer between PI and Power BI, and it often suits multi-site groups that want plant and business data together. The grain, asset context and measure definitions still need agreeing first, or the same arguments move to a new platform.
Related
 Seeq vs PI VisionPI Vision shows what the plant is doing. Seeq helps an engineer work out why it did something last Tuesday.
 PI System vs IgnitionIgnition runs the plant. The PI System keeps the record that reporting reads. Most sites asking this question have a gap at one layer.
 Data, BI and analyticsOne version of your numbers.
 Mining, energy and manufacturingOT data, historians and reporting.
Plant reporting that gets argued about?
Tell us which number two reports disagree on. That is usually where the missing definition sits.
Fixed-fee phases, agreed before we start. Stop after any phase.