Industry Solutions
Case Study
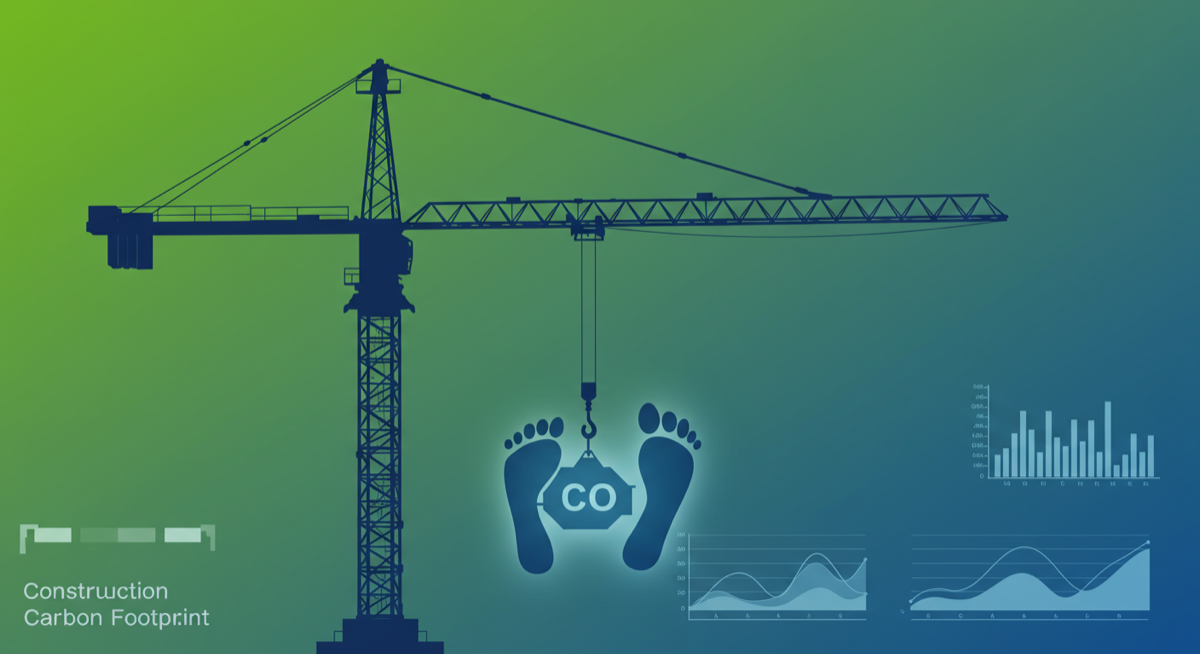
How we helped a major Australian infrastructure contractor (subsidiary of the world's largest construction company) replace chaotic ESG data collection with
Explore Solve8's full library of AI implementation guides for Australian businesses. The interactive version of this article loads while you read.